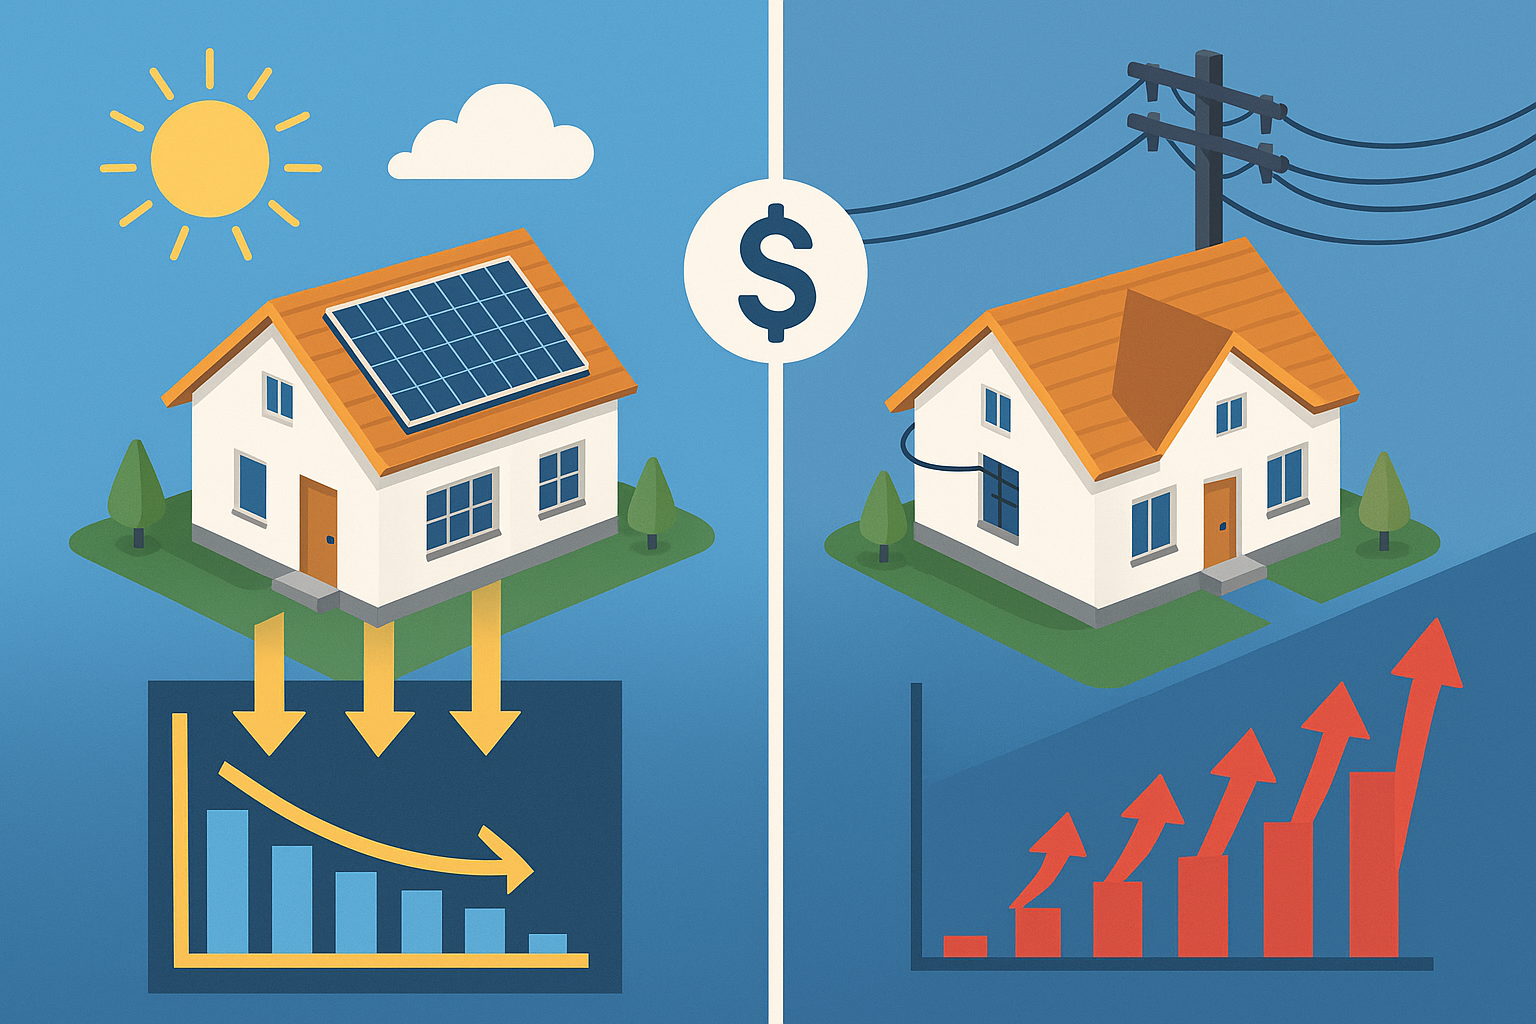
Solar Energy vs. Grid Power: Which Saves More Money?
For millions of homeowners across the United States, skyrocketing electricity bills are no longer just a concern – they’re a financial emergency. What once seemed like a noble environmental choice has now become a practical necessity. With solar panel costs dropping by over 60% since 2010 and utility rates climbing steadily year after year, the decision between solar energy and grid power is less about ideology and more about financial freedom.
But does going solar actually save you money in the long run? Or is it still too expensive for the average homeowner?
We’ve crunched the numbers, broken down the incentives, and analyzed real-world performance data to bring you the most comprehensive breakdown yet: Is solar really cheaper than staying on the grid?
The Upfront Battle: Installation Costs vs. Grid Dependence
Let’s start at the beginning – your wallet.
Solar Energy Costs: The Investment That Pays Back
Installing a residential solar system requires a significant upfront investment – but thanks to falling hardware prices and generous federal tax credits, that cost is lower than ever before.
- Average System Size: A typical U.S. home uses around 11 kW of solar capacity.
- Pre-Incentive Cost: $29,360
- Post-Tax Credit Cost: $20,552 (after applying the 30% federal tax credit under the Inflation Reduction Act)
Breakdown of Solar Costs:
| Component | Percentage |
|---|---|
| Solar Panels | 12% |
| Inverters | 10% |
| Labor & Permitting | 15% |
| Supply Chain & Marketing | 38% |
Note: Prices can vary widely depending on location, installer competition, and local permitting fees.
Regional Price Variations:
| State | Post-Credit Cost (11 kW) |
|---|---|
| New Mexico | $18,667 |
| West Virginia | $31,510 |
| California | ~$21,000 |
| Texas | ~$20,000 |
Grid Power “Costs”: The Invisible Monthly Tax
While there’s no upfront installation fee for staying connected to the grid, the long-term costs add up quickly—and often unpredictably.
- No Initial Cost, but you’re locked into annual rate hikes.
- Historical Rate Increase: Utility rates have risen by an average of 2.8% per year.
- Volatility Risk: Events like fuel shortages, geopolitical tensions, or infrastructure failures can cause sudden price spikes.
25-Year Cost Comparison (Avg. U.S. Home):
| Cost Factor | Solar Power | Grid Power |
|---|---|---|
| Initial Outlay | $20,552 (after tax credit) | $0 |
| 25-Year Total Cost | $0 (after payback period) | $45,000+ (based on $150/month bill) |
| Hidden Costs | Panel degradation (~0.5%/yr) | Regulatory fees, inflation, peak pricing |
The Long Game: Who Wins Over Time?
Solar’s Wealth-Building Mechanics
Once installed, solar panels begin paying you back—literally.
- Bill Elimination: Covers 70 – 100% of household electricity needs, reducing monthly payments to near zero.
- Net Metering: Excess energy fed back into the grid earns credits at premium rates – up to 30.69¢/kWh during peak hours in programs like Octopus Flux.
- 25-Year ROI: National averages range from $31,000 to $100,000 in savings – and much more in high-sun, high-rate states.
Top Solar Savings by State (25 Years):
| State | Avg. Lifetime Savings |
|---|---|
| California | $119,087 |
| Massachusetts | $178,505 |
| Hawaii | $134,447 |
| New York | $102,320 |
Pro Tip: Use tools like EnergySage or PVWatts to calculate your personalized savings based on your roof angle, shading, and local utility rates.
Grid Power’s Silent Budget Drain
Staying on the grid means accepting slow, compounding increases to your electric bill.
- Compound Inflation: A $150/month bill becomes $81,855 over 30 years at 2.8% annual increases.
- Time-of-Use Pricing: Many utilities now charge 3x more during peak hours (e.g., evenings), dramatically increasing costs.
Location, Location, Insolation: Why Geography Dictates Winners
Not all homes benefit equally from solar. Two key factors determine whether your investment will pay off:
- Sunlight Intensity (Insolation) – More sun = more energy generated.
- Electricity Rates – Higher grid rates mean faster payback periods.
Solar Profitability Hotspots vs. Challenger Zones:
| High-Return States | Avg. 25-Yr Savings | Lower-Return States | Avg. 25-Yr Savings |
|---|---|---|---|
| California | $119,087 | Utah | $4,285 |
| Massachusetts | $178,505 | Wyoming | $7,578 |
| Rhode Island | $134,734 | Idaho | $21,628 |
Key Insight: In sunny regions with high electricity rates (like Southern California, New York, and parts of Florida), solar now competes with grid power without subsidies—a milestone known as “unsubsidized parity.”
Beyond Panels: Storage, Heat Pumps & the Efficiency Trifecta
Maximize your return on investment by pairing solar with smart efficiency upgrades:
Battery Storage
- Store excess daytime energy for nighttime use.
- Adds $12,000 – $20,000 upfront but qualifies for ITC tax credits.
- Enables near-total grid independence.
Heat Pumps
- Use solar-generated electricity to heat and cool your home at 300 – 400% efficiency.
- Can save $300 – $1,500/year compared to gas furnaces.
EV Charging
- Powering an electric vehicle with solar cuts fuel costs by 80% versus gasoline.
- Combined with TOU tariffs, this creates a powerful synergy.
The Subsidy Dilemma: Real Costs vs. Perceived Savings
There’s ongoing debate about whether solar would be competitive without government support.
Subsidized Parity
- With the 30% federal tax credit, homeowners may effectively pay only 7¢/kWh.
- But the true cost is closer to 12¢/kWh, with taxpayers covering the difference.
Unsubsidized Parity
- In 14+ states, solar now delivers electricity cheaper than grid power without any subsidies.
- Falling equipment prices are driving this shift.
The Inflation Reduction Act extends the 30% ITC through 2032, giving homeowners ample time to lock in savings—even as hardware costs continue to fall.
Hidden Pitfalls & Smart Financing Strategies
Going solar isn’t without risks or complexities. Here’s what to watch out for – and how to finance wisely.
Financial Fine Print to Watch For
- Lease/PPA Contracts: May include annual escalators (5 – 7%), potentially costing more than grid power over time.
- Roof Suitability: Heavy shading or north-facing roofs reduce efficiency. Use NREL’s PVWatts calculator to estimate output.
- Maintenance: Minimal, but occasional cleaning ($150 – $300/year) helps maintain optimal performance.
Financing Options Compared
| Method | Upfront Cost | Long-Term Savings | Risk Level |
|---|---|---|---|
| Cash Purchase | High | Maximal (25 – 50% ROI) | Low |
| Solar Loan | Medium | High (after loan payoff) | Medium |
| Lease/PPA | None | Moderate (shared savings) | High (contract terms) |
Smart Move: If you qualify, take advantage of low-interest solar loans or cash-out refinancing to fund your installation.
Environmental Savings
While this showdown focuses on money, solar offers powerful environmental benefits:
- Carbon Reduction: A 7 kW system eliminates 6.8 metric tons of CO₂ annually—equivalent to taking 1.5 cars off the road.
- Home Value Boost: Homes with solar systems sell for ~$15,000 more, according to Zillow and other real estate platforms.
Who Wins Your Wallet?
Solar Wins If:
- You live in a high-sun/high-electricity-rate state (e.g., CA, NY, MA).
- You plan to stay in your home for 7+ years (typical payback period).
- You purchase with cash or a low-interest loan.
Grid Wins Temporarily If:
- You live in a low-rate state (e.g., WA, ID, UT) with modest sunshine.
- You lack suitable roof space or face excessive shading.
- You can’t access tax credits (e.g., due to low tax liability).
The Future Is Solar-Accelerated
Grid power’s era of cost dominance is ending.
With unsubsidized solar already cheaper than grid electricity in leading markets – and battery technology advancing rapidly—renewables are becoming the bedrock of household energy economics.
As one study notes:
“Every kWh generated by solar panels reduces your grid dependence and locks in energy costs against inflation.”
For most homeowners, the equation tilts decisively toward solar when viewed through a 10+ year lens – provided you navigate financing wisely, maximize incentives, and understand your specific situation.
Ready to Calculate Your Solar Payoff?
Use the EnergySage Calculator to input your address, utility bill, and roof specs. It compares 100+ installers and projects personalized payback periods, savings, and ROI.
Have you calculated your solar break-even point? Share your location and average bill in the comments for personalized insights!