Average electricity bill in California
California stands at a crossroads in its energy evolution. On one hand, it leads the nation in renewable energy adoption, sustainability policies, and energy efficiency standards. On the other, it grapples with an electricity crisis defined by soaring prices, regional disparities, and systemic affordability issues that increasingly burden households and businesses alike.
In 2025, California’s electricity landscape reflects a paradox: despite being a global model for clean energy innovation, it also suffers from some of the highest residential electricity rates in the United States—ranging from 30 to 33 cents per kilowatt-hour (¢/kWh), compared to the national average of just 16–19 ¢/kWh. This translates into monthly bills that are often 25–74% higher than the national average, even though Californians use significantly less electricity due to stringent efficiency standards.
This comprehensive analysis dives deep into the anatomy of California’s electricity costs in 2025, exploring the structural drivers behind the high rates, the impact on different communities, and the solutions available to consumers and policymakers alike.
1. The State of California’s Electricity Costs: A Statistical Overview
1.1 Core Pricing Metrics
The numbers paint a clear picture of California’s growing electricity affordability challenge:
- Average Monthly Bill: $155–$245 depending on usage, utility provider, and location.
- Electricity Rates: A staggering 30.96–33.5 ¢/kWh statewide average.
- Consumption Patterns: Californians consume 491–729 kWh/month, about 30% less than the U.S. average of 855–881 kWh/month. Yet, due to high rates, they end up paying more overall.
| Metric | California | U.S. Average | Variance |
|---|---|---|---|
| Price/kWh | 30.96–33.5¢ | 16.08–19¢ | +55–85% |
| Monthly Usage | 491–729 kWh | 855–881 kWh | -30% |
| Avg. Monthly Bill | $155–$245 | $140.56 | +25–74% |
| Annual Cost | $1,860–$2,940 | $1,687 | +10–74% |
These figures highlight a critical issue: energy efficiency alone cannot offset the steep cost increases.
1.2 Bill Variations by Household Profile
Electricity bills vary widely based on home size, dwelling type, and location:
- Home Size:
- Apartments (500–999 sq ft): $70–$130/month (400–550 kWh)
- Mid-Size Homes (1,500–1,999 sq ft): $200–$270/month (730 kWh)
- Large Homes (2,500+ sq ft): $350–$480+/month (1,600+ kWh)
- Dwelling Type:
- Apartments average $124/month
- Single-family homes average $239/month
| City | Avg. Monthly Bill | 3-Bedroom Home Bill | Rate per kWh |
|---|---|---|---|
| Los Angeles | $140 | $180 | 28¢ |
| San Francisco | $130 | $170 | 38¢ |
| San Diego | $160 | $210 | 42¢ |
| Sacramento | $135 | $175 | 29¢ |
| Fresno | $125 | $160 | 30¢ |
These variations underscore the importance of local utility structures, rate design, and climate-related demand in shaping consumer experiences.
2. Regional Disparities: Utility Territories Compared
California’s fragmented utility structure contributes significantly to regional differences in pricing and service quality.
2.1 Northern California: PG&E Dominance
PG&E serves much of Northern and Central California and has become synonymous with rising costs:
- Avg. Rate: 33.5 ¢/kWh, the highest in the state
- Typical Monthly Bill: $198.93
- Cost Drivers:
- Wildfire mitigation expenses totaling $27 billion from 2019–2024
- Grid hardening projects including undergrounding power lines
- Rate Increases: Cumulative rate hikes of 43% from 2022–2025
PG&E’s aggressive capital investment strategy, combined with wildfire liabilities, has led to some of the fastest-growing electricity rates in the country.
2.2 Southern California: SCE and SDG&E
Southern California is served primarily by Southern California Edison (SCE) and San Diego Gas & Electric (SDG&E):
- SCE Territory:
- Rates: 30.8 ¢/kWh
- Programs: Expanded access to community solar and time-of-use (TOU) plans
- SDG&E Territory:
- Rates: 36–42 ¢/kWh in the San Diego metro area
- Tiered pricing protects low-energy users but penalizes high consumption
SDG&E’s rates reflect its geographic exposure to wildfire risks and coastal infrastructure maintenance.
2.3 Municipal Utilities: Lower-Cost Havens
Publicly owned utilities like Sacramento Municipal Utility District (SMUD) and Los Angeles Department of Water and Power (LADWP) offer a stark contrast:
- Sacramento SMUD:
- Rate: 29 ¢/kWh
- Annual increase cap: 1.21%
- Los Angeles LADWP:
- Rate: 22–29 ¢/kWh
- Demonstrates the cost advantages of public ownership and local control
These municipal systems prioritize affordability and long-term planning over shareholder returns, offering lessons for the rest of the state.
3. Historical Trends and Future Projections
3.1 Decade-Long Escalation (2015–2025)
Over the past decade, electricity prices have surged across all major investor-owned utilities (IOUs):
- PG&E: From $0.207/kWh (2014) to $0.462/kWh (2024) — a 110% increase
- SCE: 90% increase
- SDG&E: 82% increase
Despite a 15% drop in residential electricity consumption since 2010, average bills have risen by 35%, driven by policy mandates and infrastructure costs.
3.2 2025–2030 Outlook
Looking ahead, experts project:
- Annual Rate Increases: 5–7% through 2030
- Key Cost Drivers:
- Wildfire Hardening: Over $13 billion planned for grid undergrounding and vegetation management
- Renewable Investments: Meeting the 100% clean energy target by 2045 will require massive investments in solar, wind, storage, and transmission
- Income-Based Billing: Proposed fixed fees of $24–$34/month to replace variable charges
Without intervention, SDG&E rates could reach 56.2 ¢/kWh by 2026, raising alarm among consumer advocates and lawmakers.
4. Anatomy of High Costs: Structural and Policy Drivers
4.1 Wildfire Liabilities and Grid Upgrades
Wildfires have become a defining feature of California’s energy crisis:
- Mitigation Costs: Over $27 billion passed to ratepayers since 2019
- Insurance Impacts: Premiums have increased 300%, adding $4–$6/month to bills
- Undergrounding Projects: Estimated to cost $3 million/mile, shifting costs to consumers
While necessary, these measures contribute to escalating bills without immediate benefits to ratepayers.
4.2 Renewable Energy Mandates
California’s commitment to clean energy comes with a price tag:
- Renewable Portfolio Standard (RPS): Requires 60% renewable sourcing by 2030
- Investment Needs: Over $120 billion in new solar, wind, and battery infrastructure
- Cost Shifting: Net Energy Metering (NEM) subsidies shift $3.4 billion annually from non-solar to solar customers
While renewables reduce emissions, their integration adds complexity and cost to the system.
4.3 Rate Design Complexities
California’s rate structure is among the most complex in the nation:
- Tiered Pricing:
- Baseline usage: ~300 kWh at 30 ¢/kWh
- Excess usage: 40–50 ¢/kWh
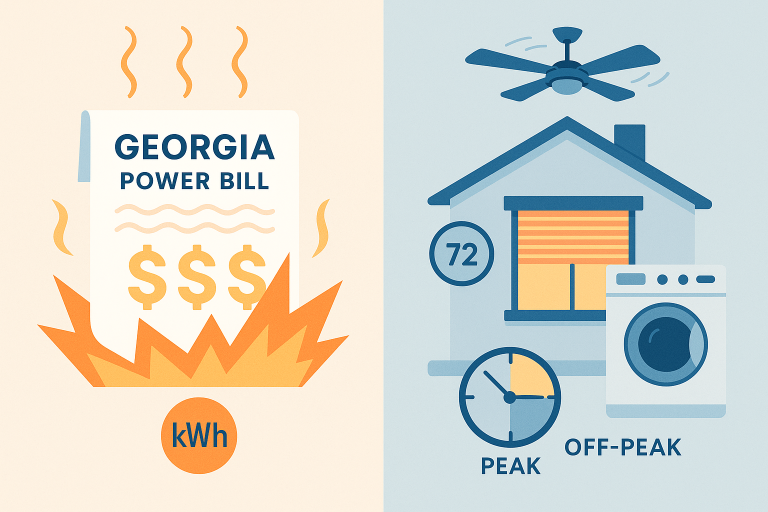
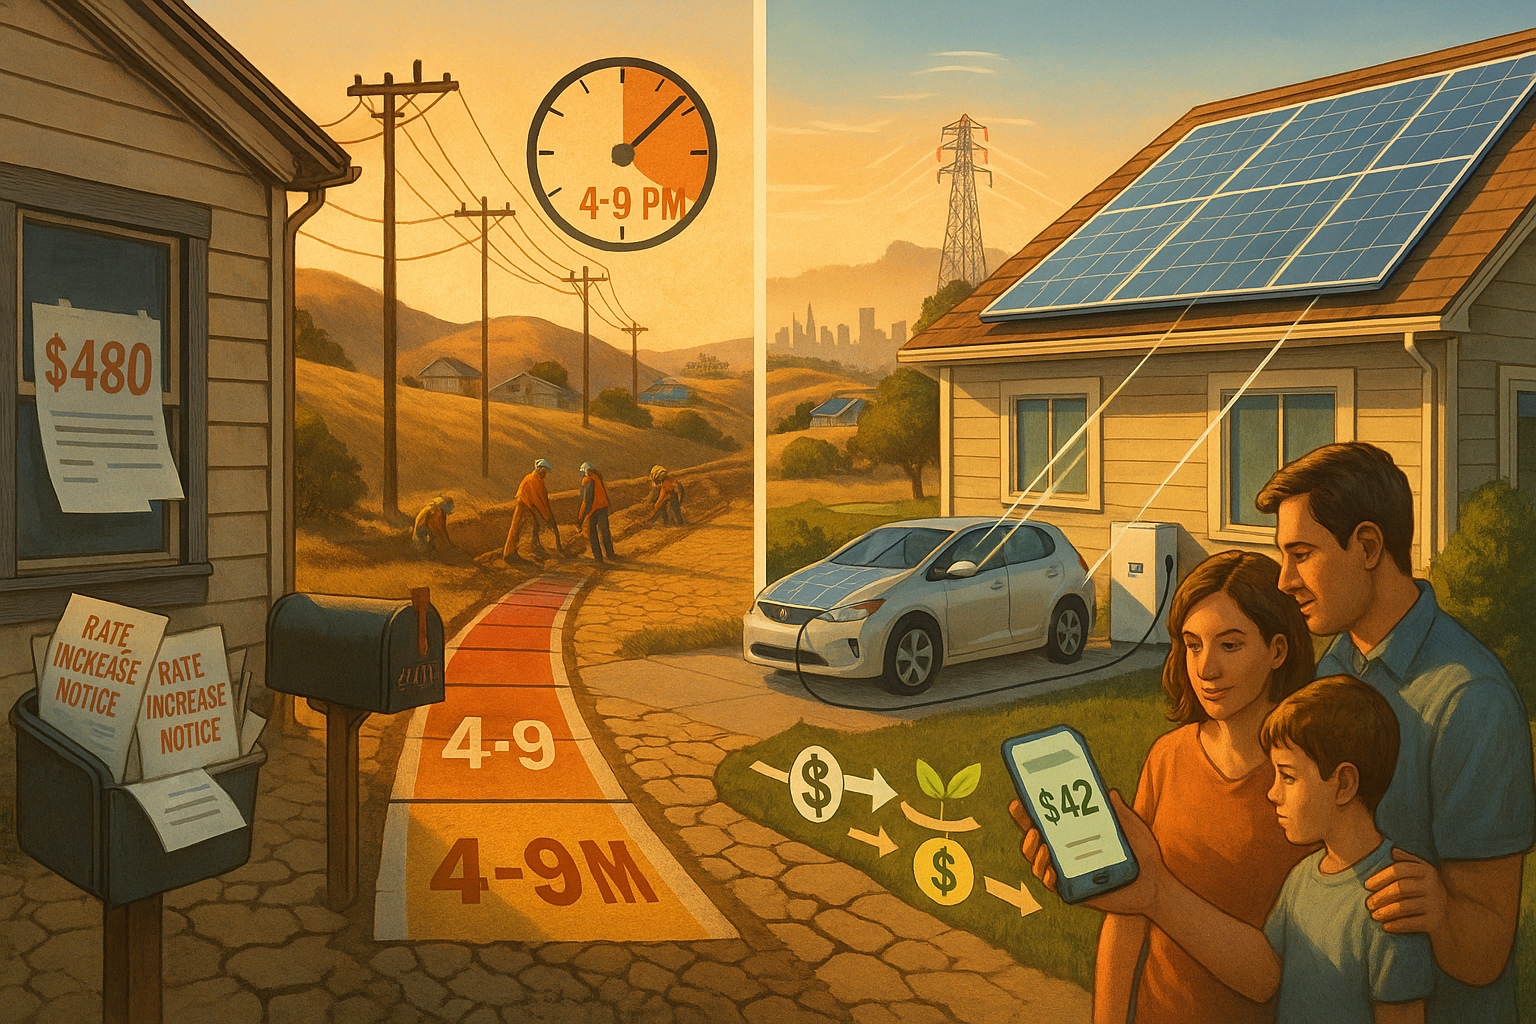
- Time-of-Use (TOU) Rates:
- Off-Peak (before 3 PM/after 9 PM): 25 ¢/kWh
- Peak (4–9 PM): 50–60 ¢/kWh
- Fixed Charges: Monthly service fees of $10–$18, regardless of usage
These structures aim to encourage conservation and manage peak demand, but they disproportionately affect low-income and fixed-income households.
4.4 Utility Profit Models
Investor-owned utilities operate under a unique regulatory framework:
- Guaranteed Returns: IOUs earn 10.5% profit margins on approved capital expenditures
- Incentives for Spending: Encourages over-investment in infrastructure rather than efficiency or affordability
- Profit Example: In 2024, PG&E reported record profits of $4.2 billion, even as it raised rates
This model creates misaligned incentives between utility shareholders and ratepayers.
5. Consumer Strategies: Reducing Bills Amid High Rates
Faced with high electricity costs, consumers can take proactive steps to lower their bills:
5.1 Behavioral and Efficiency Measures
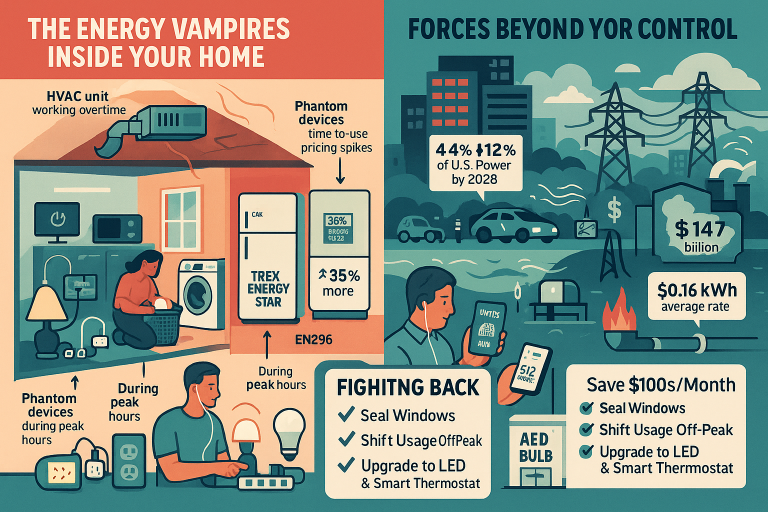
- TOU Optimization: Shift EV charging, laundry, and cooling to off-peak hours; saves $14–$69/month
- Efficiency Upgrades:
- LED lighting: Saves $100/year
- Smart thermostats: Reduce HVAC costs by 10–15%
- Energy Audits: Free assessments via utility programs identify air leaks, phantom loads, and insulation gaps
5.2 Solar and Storage Solutions
- Rooftop Solar:
- System Cost: $12,000 for a 5.4 kW system (pre-incentives)
- Payback Period: 5.9 years
- 20-Year Savings: $106,900
- Battery Add-Ons:
- Avoid 50¢/kWh peak TOU charges
- Provide backup during Public Safety Power Shutoffs (PSPS)
- Community Solar:
- Renters and multi-family dwellers save 5–15% via shared solar farms
Solar plus storage is becoming a viable path to energy independence and bill reduction.
5.3 Financial Assistance Programs
Several state and federal programs exist to support struggling households:
- CARE Program: Offers 20–35% discounts for households earning ≤200% of federal poverty level
- FERA Program: Provides reduced rates for families of 3+ earning ≤250% of poverty level
- Inflation Reduction Act Rebates: Up to $14,000 for heat pumps, insulation, and electrical upgrades
These programs are vital for ensuring equity in the transition to clean energy.
6. Policy Solutions: Addressing Systemic Affordability
To tackle the root causes of high electricity costs, California must rethink its energy policies:
6.1 Rate Reform and Cost Allocation
- Income-Based Fixed Fees: Proposals suggest setting $24–$34/month flat fees to stabilize revenues while protecting low-income users
- Tax-Funded Programs: Redirect wildfire mitigation costs from electricity bills to general fund budgets
6.2 Grid Modernization Innovations
- Virtual Power Plants (VPPs): Aggregate home batteries to supply 600–800 MW during peak demand, reducing reliance on fossil fuel peakers
- Third-Party Transmission: Allow non-utility companies to build power lines, potentially cutting financing costs by 30%
Modernizing the grid with decentralized technologies can improve reliability and reduce costs.
6.3 Regulatory Accountability
- Performance-Based Ratemaking: Tie utility profits to reliability and customer satisfaction metrics, not just capital spending
- Rate Caps: Proposed limits of 4% annual increases to prevent sudden spikes in household bills
Reforming how utilities are regulated and compensated is essential to aligning their goals with those of consumers.
7. The Road Ahead: Balancing Sustainability and Affordability
As climate change intensifies and electrification accelerates, California faces a dual mandate: achieving carbon neutrality by 2045 while ensuring affordable, equitable access to electricity.
Projected trends indicate that peak demand could grow by 40% by 2035, driven by increasing heatwaves and widespread adoption of electric vehicles, appliances, and heating systems.
However, solutions are within reach:
- Distributed Energy Growth: Rooftop solar and home batteries could supply 20% of peak capacity by 2030
- Legislative Action: Passage of bills like SB 302 could streamline clean energy tax credits and reduce project costs
- Consumer Empowerment: Real-time monitoring apps like Sense, Tesla app, or utility dashboards allow precise control over energy use
The Bottom Line: While California’s average electricity bill of $155–$245/month reflects deep systemic challenges, proactive households can mitigate impacts through solar adoption, TOU optimization, and energy efficiency. Long-term affordability, however, requires policymakers to confront utility profit models, wildfire cost structures, and regressive rate designs head-on.
Toward a Just and Sustainable Energy Future
California’s electricity crisis is not merely a technical problem—it is a reflection of broader societal priorities and trade-offs. As the state continues to lead in clean energy innovation, it must also lead in ensuring that this transition does not leave millions behind.
The road forward demands policy courage, technological ingenuity, and consumer empowerment. With the right mix of reforms, investments, and advocacy, California can chart a path where clean energy and fair pricing coexist—not compete.